
By doing A / B testHave you ever wondered if the results are statistically significant?
As marketers, we are not only asked to measure the results of our campaigns, but also to demonstrate the credibility of the results.
Содержание | Быстрая навигация
How to calculate statistical significance?
- Determine what you want to test.
- Define your hypothesis.
- Start collecting your data.
Practical example. Each of the two marketers created a version of the landing page. They used the functionality of their A / B HubSpot test to collect results. They had a friendly bet to win.
After a few days, they had results. One had a slightly higher conversion rate. They wondered if the results were statistically significant.
There are a number of free tools available for calculating statistical significance. To truly understand what these tools say, it is helpful to study them. Especially what they count and what it means. We will provide a specific example to help you understand the statistical significance.
1. Determine what you want to test.
First, decide what you want to test. This could be a comparison:
- conversion rates on two landing pages with different images;
- conversion rates for email with different subject lines;
- conversion rates for different call-to-action buttons at the end of the blog post. The number of options to choose from is endless.
Select the piece of content for which you want to create two different variations. First, decide if your goal is better conversion rate or more views.
You can of course test additional variations or even create a multidimensional test. For the purposes of this example, we'll stick with two landing page options. This will increase your conversion rate.
2. Define your hypothesis.
Before I start collecting data, I find it helpful to state my hypothesis at the beginning of the test. I also need to determine the degree of reliability that I want to check.
I am testing a landing page and want to see if it gets better. My hypothesis: There is a relationship between the landing page that visitors get and their conversion rate.
3. Start collecting your data.
Now that you've determined what you want to check, it's time to start collecting your data.
You will most likely run this test to determine which piece of content is best to use in the future. You need to choose a sample size. For a landing page, this could mean choosing a specific time to run a test. For example, activating your page within 3 days.
For something like an email, you can choose a random sample of your list. Your email variations will be sent spontaneously.
Determining the correct sample size can be difficult. It will vary depending on each test.
As a general rule of thumb, you want the expected value for each variation to be greater than 5.
We'll look at the expected values below.
4. Calculate the chi-square results.
There are a number of different statistical tests that you can run. This will measure the significance based on your data. What's the best way to use it? It depends on what you are trying to check and what type of data you are collecting.
In most cases, you will use the chi-square test because the data is discrete.
The discrete way says that there are a finite number of results that can be obtained. For example, a visitor will either convert or not convert. There are no different conversion rates for one visitor.
You can test based on varying degrees of confidence. It is sometimes called the alpha test. If you want the requirement for statistical significance to be high, alpha must be low. You may have seen statistical significance in terms of reliability.
For example, the results obtained are statistically significant with a confidence level of 95%. In this scenario, the alpha was 0.05. Confidence is calculated as 1 minus alpha. This means that the probability of being mistaken in the stated relationship is 1 in 20.
After collecting the data, I put it in a diagram to make it easier to organize it. I am testing 2 different options A and B. There are 2 possible results, converted, not converted, I will have a 2 × 2 graph. I will sum each column and row so that I can easily see the results in the aggregate.
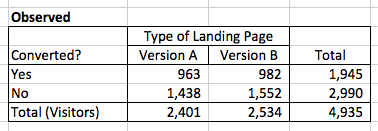
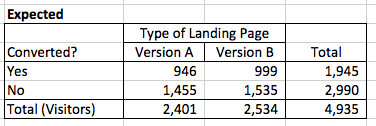
5. Calculate your expected values.
Now I will calculate the expected values. In the example above, we would expect to see the same conversion rates with both versions. This is in case there was no connection between what the landing page visitors saw and their conversion rate. 1945 out of 4,935 visitors turned out to be converting. That's about 39% visitors.
You need to calculate the expected frequencies for each version of the landing page, assuming there is no difference. We can: multiply the number of rows for this cell by the number of columns for this cell and divide it by the number of visitors. In this example, you need to find the expected conversion value in version A. I would use the following equation: (1945 * 2401) / 4935 = 946.
6. See how your results differ from what you expected.
To calculate the chi-square, I compare the observed frequencies to the expected frequencies.
This comparison is done like this:
- subtracts the observed from the expected,
- squared the result,
- the result is divided by the expected frequency.
I am trying to understand how my actual results differ from what we can expect. Squaring the difference amplifies the effect of the difference, and dividing by the expected normalizes the results. The equation looks like this: (expected - observed) ^ 2) / expected.
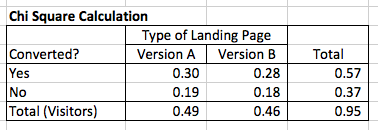
7. Find your amount.
I then add the four results to get the chi-square number. In this case, it is 0.95. I need to see if the conversion rates for my landing pages differ from statistical significance. I compare this to the value from the chi-squared distribution table. It is based on my alpha, in this case 0.05, and degrees of freedom.
The degree of freedom depends on how many variables you have. With a 2x2 table as in this example, the degree of freedom is 1.
In this case, the chi-square value must be equal to or greater than 3.84. Then the results will be statistically significant. Since 0.95 is less than 3.84, my results are not statistically different. There is no relationship between which version of the landing page a visitor receives and the conversion rate with statistical significance.
Why is statistical significance important?
Why is this important if you can just use a free tool to do the calculations?
By understanding how statistical significance is calculated, you will determine how best to test the results of your own experiments.
Many instruments use the 95% confidence level. For your experiments, it may make sense to use a lower confidence level. This is the case if you do not want the test to be more stringent.
Understanding the basic calculations will help you explain to those unfamiliar with statistics why your results are important.
Based on materials from the site: https://blog.hubspot.com.
❤️ When will the test be statistically significant, generally speaking?
If there is a very low chance that the result could have happened by accident.
❤️ Why is it especially important to calculate statistical significance?
To exclude unpromising hypotheses.
⏩ What is the significance level?
This is the probability of rejecting the null hypothesis when it is correct.
⏩ What is the influence of the p-value?
The smaller the p-value, the more confidence that the null hypothesis can be rejected.
⏩ How to calculate statistical significance?
Start by looking at the left side of your degrees of freedom and find your variance. Then go up to see the p-values. Compare the p-value with the significance level, or rather the alpha. Remember that a p-value less than 0.05 is considered statistically significant.
⏩ How to determine statistically significant results?
To do a Z-test, find the Z-score for your test or study and convert it to a P-value. If your P-value is below the significance level, you can conclude that the result is statistically significant.
⏩ What is p-value in statistics?
In statistics, a p-value is the probability of getting results that are at least as extreme as the observed results of a statistical hypothesis test, provided that the null hypothesis is correct. A smaller p-value means that there is stronger evidence for the alternative hypothesis.


2 thoughts on “A/B тест: как рассчитать статистическую значимость результатов?”
How did you get "(expected - observed) ^ 2) / expected" values 0.3, 0.28, etc.?