
From testing the wrong things to the wrong A / B tests, people don't get the results they want when testing their site... In fact, there are many nuances in which a beginner can be mistaken. Therefore, it is necessary to take a responsible approach to A / B testing.
Содержание | Быстрая навигация
What is A / B testing?
When researchers test the effectiveness of new drugs, they use a "split test". In fact, most research experiments could be considered a "split test" because it is complemented by hypothesis, control, variation, and statistically calculated outcome.
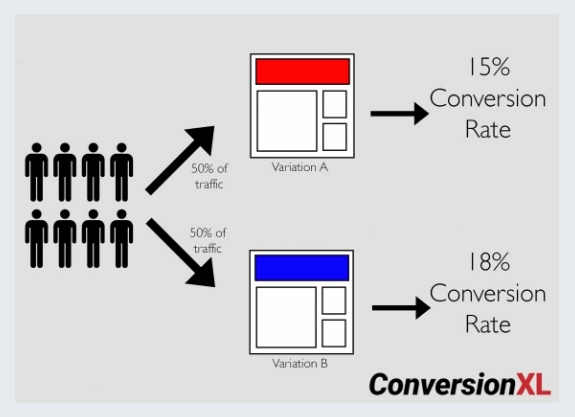
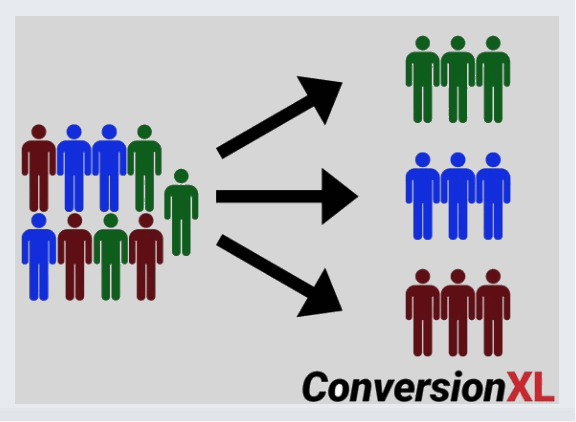
Also with A / B testing, 50/50 traffic will be split between the original page and the variation:
For conversion optimization, the main difference is changes in internet traffic. It is easier to control external variables in the laboratory. You can mitigate them online, but it is difficult to create a fully supervised test.
In addition, testing new drugs requires an almost certain degree of precision. Lives on the line. From a technical point of view, your "exploration" period can be much longer, as you want to be sure that you do not make the first type of error - a false positive.
Online, the A / B split testing process takes into account business goals. He weighs risk and reward. Therefore, we view the results from a different point of view and make decisions differently than those performed in the laboratory.
Of course, you can create more than two options. Tests with more than two variations are known as A / B / n tests. If you have enough traffic, you can test as many options as you like. Here's an example of an A / B / C / D test, and how much traffic is allocated to each option:
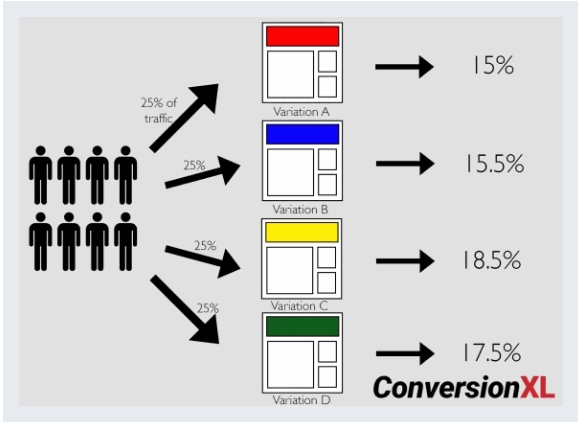
A / B / n tests are great for realizing more variations of the same hypothesis, but they require more traffic because they split it across multiple pages.
Although A / B tests are the most popular, they are just one type of online experimentation. You can also run multivariate tests.
Multivariate testing and A / B / n algorithms. What is the difference?
A / B / n tests are controlled experiments... Runs one or more variations on the original page at the same time. To get a result, the conversion rates are compared among the options based on one change.
Multivariate tests check multiple versions of a page to determine which attributes have the greatest impact. In other words, multivariate tests are similar to A / B / n tests in that they check the original against variations, but each contains different design elements. For example:
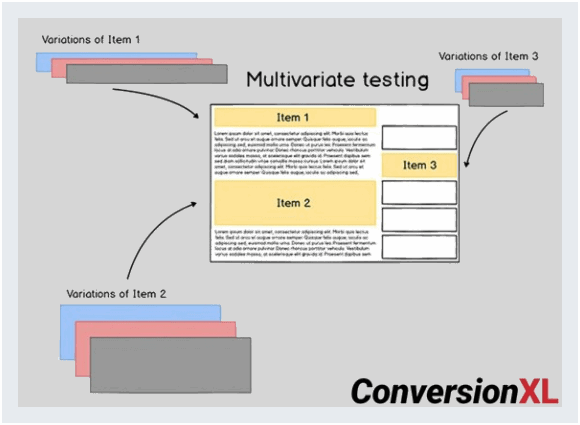
This multidimensional test example shows 3 items on a page with three different options. If such a test is carried out as an AB test, then we need to conduct 3 third-degree variants. A total of 27 tests.
Use A / B testing to determine the best layouts.
Apply multivariate tests to refine your layouts and ensure that all elements interact well with each other.
You need to have huge traffic on the page you are testing before considering multivariate testing.... But if you have enough traffic, you should use both types of checks in your optimization program.
Most agencies favor A / B testing because you tend to test larger changes with greater potential impact, and because they are easier to implement. As Pip once said, "Most of the top agencies I've talked to about this do ~ 10 A / B tests for every 1 MW."
A / B / n Algorithms are A / B / n tests that are updated in real time based on the performance of each option.
Basically, the A / B / n algorithm starts by sending traffic to two or more pages: original and variant n. Then, in order to "win more often", the algorithm is updated depending on which option is the most successful. In the end, the algorithm makes full use of the best option:
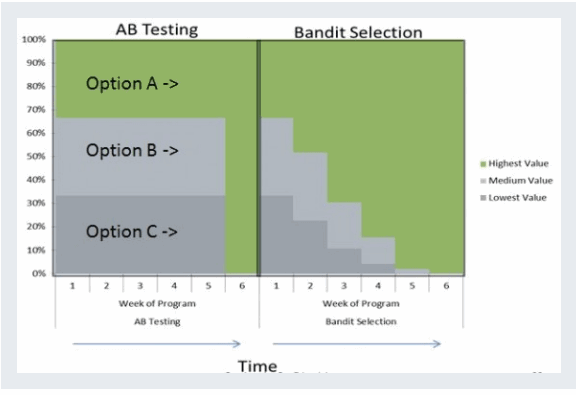
One of the benefits of A / B / n testing is that it mitigates negative results.
A / B / n tests are great for:
- headlines and short-term campaigns;
- automation for scale;
- orientation;
- blending optimization with attribution.
Regardless of what type of test you're doing, it's important to get the gist in order to choose the one that improves your chances of success. This means more tests need to be done.
How can I improve my A / B test scores?
Ignore the "99 Things You Can Test Right Now" blog posts. This is a waste of time and traffic. The process won't make you more money.
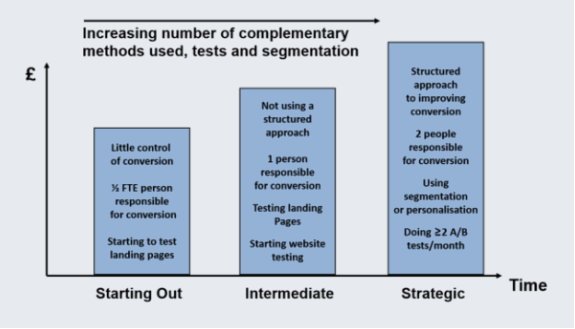
Approximately 74% SEOs with a structured approach to conversion also report improvements sales... Those without a structured approach are left with what Craig Sullivan calls a “trough of frustration,” unless their results are inundated with false positives, which we'll talk about later.
To simplify the winning process, the structure looks something like this:
- study;
- prioritization;
- experimentation;
- analysis, accounting and repetition.
To start optimizing, you need to know what your users are doing and why.
So, you need to think in the following order:
- Define your business goals.
- Define the goals of your site.
- Define your KPIs.
- Define your targets.
Once you know where you are going. You will be able to collect the data you need to achieve your goals. We recommend the ResearchXL Framework for this.
Here's a rundown of the process we use in CXL:
- heuristic analysis;
- technical analysis;
- analysis of web analytics;
- machine tracking analysis;
- quality polls;
- user testing and copying.
Heuristic analysis is close to "best practices". Even after years of experience, you won't be able to tell exactly what will work. But you can define areas of opportunity.
It helps build structure. When performing heuristic analysis, we evaluate each page based on the following:
- relevance;
- clarity;
- value.
Technical analysis is often overlooked. Errors, if any, kill conversions. You might think that your website works great in terms of user experience and functionality. But does it work equally well with every browser and device? Probably no.
So let's start with:
- Performing cross-browser and cross-device testing.
- Speed analysis.
- Web analytics analysis. Make sure everything works. You will be surprised at how many analytics settings can be violated.
Next, mouse tracking analysis is applied, which includes heatmaps, scrollmaps, heatmaps, form analytics, and user session replays. Don't get carried away with visualizing heat maps.
Many people believe that quality analysis “Softer” or simpler than quantitative, but it must be just as rigorous and can provide insights as important as analytics.
For qualitative research, use things like:
- field surveys;
- customer surveys;
- interviews with clients and focus groups;
- user testing.
The idea is simple: Observe how real people use and interact with your website. Pay attention to what they are saying and what they are experiencing.
By testing the original, you will find out how your real target audience perceives the site, what is clear or unclear which arguments they take into account and which are not.
After careful research, you will have a lot of data. The next step is to prioritize this data for testing.
How to prioritize an A / B hypothesis.
There are many structures for prioritizing your A / B tests, and you can even innovate with your own formula. A way to prioritize work. After going through all the steps, you will find problems - major and minor. Distribute each find in one of five segments:
- Test. In this part, you post things to test.
- Tool. This may include fixing, adding, or improving the handling of tags or events in analytics.
- Putting forward a hypothesis. Here you find a page, widget, or process that is not working as expected.
- Just do it... Everything is clear here. Work on bugs.
- Explore... You need to ask questions or dig deeper.
Rate the significance of each issue from 1 to 5 stars, 1 = minor, 5 = critical.
There are two criteria that are more important than others when evaluating:
- Ease of implementation: time, complexity, risk. Sometimes the data tells you about creating a feature that will take months to develop. Don't start with it.
- Possibility. Evaluate the questions subjectively, depending on how strongly they can cause uplift or change.
Create a spreadsheet with all your data. You will have a priority test plan. We developed our own prioritization model to weed out subjectivity as much as possible. This is based on the need to enter data into the table. It's called PXL and looks like this:
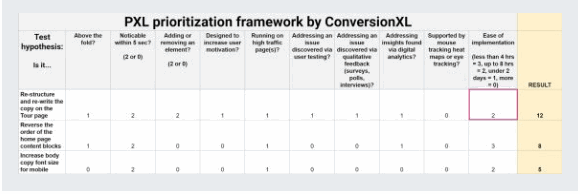
Rather than guessing how this might affect, this framework asks you a series of questions:
- Change above the fold? More and more people notice changes that exceed them. Thus, these changes are likely to have an impact.
- Is the change noticeable in less than 5 seconds? Show a group of people control, and then the “and” variation. Can they show the difference in 5 seconds? If not, then it may have less impact.
- Does it add or remove anything? Bigger changes, like removing distractions or adding key information, have a bigger impact.
- Is the test performed on high traffic pages? Improving a high traffic page gives you more bang for your buck.
Many potential test variables require data to prioritize your hypotheses. The weekly discussions that ask these four questions will help you prioritize data-driven testing, not opinions:
- Does this fix an issue found in user testing?
- Is it a solution to a problem discovered through quality feedback: surveys, interviews?
- Is the hypothesis supported by mouse tracking, heat maps, or eye tracking?
- Are there any inconsistencies in ideas from digital analytics?
We also restrict the ease of implementation by brackeing the answers according to the estimated time. Ideally, the test designer is part of the priority discussion.
PXL score.
We assume a binary scale: you need to choose one or the other. Thus, for most variables, choose either 0 or 1.
But we also want to weight the variables based on importance. How noticeable is the change if something is added or removed? For these variables, we specifically say how things change. For example, in the Visibility field of the Change variable, you can mark it as 2 or 0.
Customizability.
We created this model assuming that you can and should tweak variables based on what's important to your business.
For example, perhaps you are working with a branding or user experience team and the hypotheses need to be consistent with the brand guidelines. Add this as a variable.
You might be in a startup whose engine is SEO. Perhaps your funding depends on this flow of clients. Add a category like "SEO" to help you change some of the headings or copy tests.
All organizations operate under different assumptions. Customizing the template can take them into account and improve your optimization program.
Whatever structure you use, make it systematic and understandable for everyone on the team, as well as stakeholders.
How long do A / B tests take?
First rule: don't stop a test just because it reaches statistical significance. This is probably the most common mistake made by well-meaning beginner optimizers.
If you stop testing when you reach significance, you will find that most of the methods do not result in increased income.
Consider the following: when 1000 A / A tests were run (two identical pages):
- 771 out of 1000 experiments reached 90% significance at some point.
- 531 out of 1000 experiments reached 95% significance at some point.
Stopping tests for significance runs the risk of false positives and eliminates validity guarantees such as seasonality.
Determine your sample size and run testing for full weeks, usually at least two work cycles.
How do you determine the sample size? There are many great tools out there. Here's how you can calculate the sample size using Evan Miller's tool:
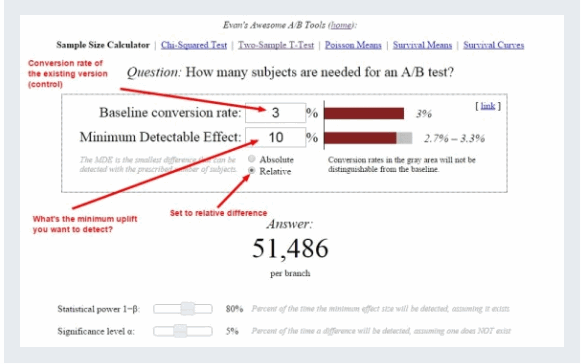
In this example, we indicated to the instrument that we have a coefficient conversions 3% and we want to spot a rise of at least 10%. This tool tells us that we need 51,486 visitors for each variation before we can look at the levels of statistical significance.
Besides the level of significance, there is something called statistical power. Statistical power tries to avoid Type II errors (false negatives). In other words, it increases the likelihood that you will find an effect, if there really was one.
For practical purposes, know that 80% Power is the standard for A / B testing tools. To achieve this level, you will need either a large sample size, a large effect size, or a longer test.
There are no magic numbers.
Many blog posts advertise magic numbers like “100 conversions” or “1000 visitors” as stopping points. Mathematics is not magic. What we are dealing with is a little more complex than a simplified heuristic like these numbers. Andrew Anderson of Malwarebytes put it well:
We want a representative sample. How can we get this? Test for two business cycles to mitigate external factors:
- Day of the week. Your daily traffic can vary greatly.
- Traffic sources. Unless you want to personalize the experience for a dedicated source.
- Blog posting schedule and newsletter.
- Return visitors. People can visit your site, think about buying, and then come back 10 days later to buy it.
- External events. For example, a salary in the middle of the month can affect a purchase.
Be careful with small sample sizes. The internet is full of case studies steeped in unrealistic mathematics. Most studies, if they ever published full numbers, would show that publishers rated test options per 100 visitors.
Once you've got everything set up correctly, don't look at the test results until after the test. This can lead to early results due to "trend detection". You will find that many of the test results fall back to the mean.
Regression to the mean.
You will often notice that the results vary greatly in the first few days of the test. Of course, they tend to converge as the test continues over the next few weeks. Here is an example with site ecommerce:
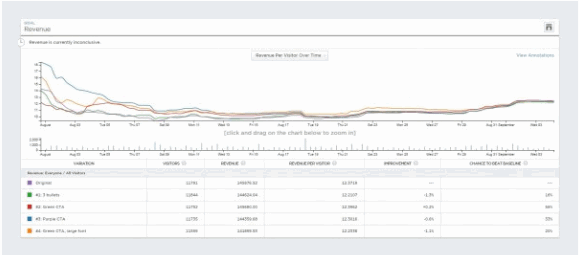
- First couple of days: Blue Line or Option # 3 wins - around $ 16 per visitor versus $ 12.50 for control. Many people would end up testing here by mistake.
- After 7 days: Option # 3 still wins and the relative difference is large.
- After 14 days: Orange line or option # 4 wins!
- After 21 days: No. 4 still wins!
If you stopped the test in less than four weeks, you would be in the wrong conclusion.
There is a related problem: the novelty effect. The novelty of your changes, such as a large blue button, draws more attention to the variation.
Stopping A / B tests: how many conversions do I need?
Some experts say that you shouldn't run multiple tests at the same time. Some say it's okay. In most cases, multiple concurrent tests will perform well, extreme interactions are unlikely.
Unless you are testing really important things, like something that affects your business model, the future of the company, the benefits of testing volume will probably outweigh the noise in your data and random false positives.
If there is a high risk of interoperability between multiple tests, reduce the number of concurrent tests and allow tests to run longer to improve accuracy.
How do I set up A / B tests?
Once you've got your priority list of test ideas, it's time to hypothesize and experiment. The hypothesis determines why this problem occurs. Also, a good hypothesis:
- Verifiable. The result is measurable, so it can be verified.
- Solves the conversion problem.
- Provides market insight. With a well-articulated hypothesis, the results of your split testing give you information about your customers, whether the test "won" or "lost".
Craig Sullivan has a set of hypotheses to simplify the process:
- What we saw: data and feedback,
- We expect the change to have an impact.
- We will measure this using a data metric.
And advanced:
- Because we have seen qualitative and quantitative data.
- We expect that changing for will have an impact.
- We expect to see the data metric change over the period.
- Grounds for technical transformation.
- Here's the final piece: you can finally think about choosing a tool.
While this is the first thing many think about, it is not the most important thing. Strategy and statistical knowledge come first.
However, there are a few differences to keep in mind. One of the main categories of tools are server-side or client-side testing tools.
Server-side tools display code at the server level. They send a randomized version of the page to the viewer with no changes to the visitor's browser. Client-side tools send the same page, but JavaScript in the client's browser controls the appearance of the original and its variation.
Client side testing tools include Optimizely, VWO, and Adobe Target. Conductrics has capabilities for both, and SiteSpect uses a proxy-side method.
What does all this mean to you? If you want to save time ahead of time, or your team is small or lacks development resources, client-side tools can help you get started faster. The back end requires development resources, but can often be more reliable.
While setting up tests is slightly different depending on which tool you use, it is often as simple as subscribing to your favorite tool and following its instructions, such as placing a piece of JavaScript on your website.
In addition, you need to set Goals to know when the conversion was made. Your testing tool will track when each variation converts visitors to customers.
The following skills will come in handy when setting up A / B tests: HTML, CSS, and JavaScript / JQuery, as well as design and copywriting skills to create variations. Some tools allow you to use a visual editor, but this limits your flexibility and control.
How do I analyze the results of an A / B test?
Okay. You've done your research, set up your test correctly, and it's finally ready. Now let's move on to the analysis. It's not as easy as looking at a graph.
One thing you should always do: analyze your test results in Google Analytics. It doesn't just expand your analysis capabilities; this allows you to be more confident in your data and decisions.
Your testing tool may not be recording information correctly. Unless you have another source for your test data, you can never be sure of the accuracy of the results. Create multiple data sources.
What happens if there is no difference between variations?
- Your hypothesis may have been correct, but the implementation was incorrect.
Let's say your qualitative research suggests that the problem is not dangerous. How many ways are there to improve the perception of security?
The name of the game is iterative testing, so if you wanted something, try a few variations.
- Even if there was no difference overall, variation can beat control in a segment or two.
If you have received support for regular and mobile visitors, but not for new visitors and desktop users, these segments can cancel each other out, giving the impression that there is “no difference”. Analyze your test by key segment to investigate this possibility.
Data segmentation for A / B tests.
The key to learning A / B testing is segmentation. While B might outperform A in overall performance, B might outperform A in certain segments: regular, Facebook, mobile, etc.
There are many segments that you can analyze. Optimally, the following are listed:
- browser type;
- source type;
- mobile or desktop computer or device;
- registered and logged in visitors;
- PPC / SEM campaign;
- geographical regions: city, region, country);
- new versus regular visitors;
- new and repeat customers;
- power users versus casual visitors;
- men against women;
- age range;
- new and already submitted leads;
- types of plans or levels of the loyalty program;
- current, potential and former subscribers;
- roles: for example, if your site plays the role of buyer and seller.
At least assuming you have a sufficient sample size, take a look at these segments:
- desktop versus tablet or mobile phone;
- new relatively old;
- traffic that hits the page versus internal link traffic.
Make sure you have enough sample size in the segment. Calculate it in advance, and be careful if there are less than 250-350 conversions per variation in this segment.
If your processing has performed well for a specific segment, it's time to consider a personalized approach for those users.
How do I archive passed A / B tests?
A / B testing is not only about winning, losing, and testing random plots. As Matt Gershoff said, optimization is "gathering information to make decisions." Lessons learned from statistically significant A / B tests drive big growth and optimization goals.
Smart organizations archive their test results and systematically plan their testing approach. A structured approach to optimization gives more growth and is less likely to be limited to local highs.
So here's the tricky part: There is no single best way to structure knowledge management. Some companies use sophisticated built-in tools, others use third-party tools; and still others use Excel and Trello.
If that helps, here are three tools built specifically for managing conversion optimization projects:
- Iridion;
- effectiveexperiments.com;
- projects.growthhackers.com.
It is important to communicate between departments and managers. Often times, A / B test results are not intuitive to the layperson.
A / B testing statistics.
Why do you need to know statistics? Matt Gershoff likes to quote from his college math teacher: "How can you make cheese if you don't know where the milk comes from ?!"
There are three conditions you need to know before we dive into the details of A / B testing statistics:
- Value. We do not measure all conversion rates, only a sample. The mean is a representative of the whole.
- Deviation. What is the natural variability of the population? This affects our results and how we use them.
- Sample selection. We cannot measure the true conversion rate, so we select a sample that is representative.
What is p-value?
Many people use the term “statistical significance” inaccurately. Statistical significance is not itself a stopping rule, so what is it and why is it important?
First, let's look at p-values, which are also very misunderstood. As FiveThirtyEight recently pointed out, even scientists cannot easily explain p-values.
The p-value is a measure of evidence against the null hypothesis, or control, in the language of A / B testing. The p-value does not tell us the likelihood that B is better than A.
Likewise, this does not tell us the likelihood that we will make a mistake when choosing B over A. These are common misconceptions.
The p-value is the likelihood of seeing the current outcome or more extreme given that the null hypothesis is correct. Or "How amazing is this result?"
In summary, statistical significance or a statistically significant result is achieved when the p-value is less than the significance level, which is usually set at 0.05.
Confidence intervals and margin of error.
Your conversion rate isn't just saying X%. He says something like X% (+/- Y). The second number is the confidence interval and is extremely important in understanding your test results.
In A / B testing, we use confidence intervals to reduce the risk of sampling errors. In this sense, we manage the risk associated with the introduction of a new option.
So if your tool says something like, “We at 95% are confident that the conversion rate is X% +/- Y%,” then you need to consider +/- Y% as the margin of error.
How confident you are in your results depends largely on how large the margin of error is. If the two conversion ranges overlap, you need to continue testing to get a valid result.
Sinusoidal data.
A stationary time series has statistical properties: mean, variance, autocorrelation, etc. They are constant over time. For many reasons, website data is not stationary, which means that we cannot make the same assumptions as for stationary data. Here are some reasons the data may fluctuate:
- season;
- day of the week;
- holiday;
- positive or negative press mentions;
- other marketing campaigns;
- Checkpoint / SEM;
- SEO;
- word of mouth.
Others include sample contamination, flicker effects, revenue tracking errors, selection bias, and more. Keep this in mind when planning and reviewing your A / B tests.
Bayesian or frequent statistics.
Bayesian or Frequentist A / B testing is another hot topic. Many popular tools have redesigned their statistics engines to use Bayesian methodology.
Here's a simplified difference in terms of Bayesian probability: A hypothesis is assigned a probability. According to Frequentist, a hypothesis is tested without a probability assignment.
Don't get me wrong, every methodology has practical business implications. But if you're new to A / B testing, there are much more important things to worry about.
A / B testing tools and resources.
There are many tools for experimenting online. Here is a list of 53 conversion optimization tools reviewed by the experts. Some of the most popular A / B testing tools include:
- Optimizely;
- PUO;
- Adobe Target;
- Maximyser;
- Conductrics.
A / B testing of calculators.
- AB Test Calculator from CXL;
- A / B Separation Test Significance Calculator from VWO;
- A / B Split and Multivariate Duration Calculator Test from VWO;
- Evan Miller's Sample Size Calculator.
A / B testing statistics resources.
- A / B Testing Statistics: An easy-to-understand guide
- Statistical analysis and A / B testing;
- Understanding the statistics of A / B testing to get REAL Lift in conversions.
Output.
A / B testing is an invaluable resource for anyone making decisions in an online environment. With a little knowledge and diligence, you can mitigate many of the risks that most aspiring SEOs face.
If you really dig deeper into this information, you will be ahead of the 90% test people. If you believe in the power of A / B testing, this is a fantastic opportunity for further revenue growth.
Knowledge is a limiting factor that can only be surpassed by experience and iterative learning. So get tested!
✓ What are A / B / n tests?
A / B / n tests are controlled experiments. Runs one or more variations on the original page at the same time. To get a result, the conversion rates are compared among the options based on one change.
✓ What are biases used in A / B testing?
In A / B testing, we use confidence intervals to reduce the risk of sampling errors. In this sense, we manage the risk associated with the introduction of a new option.
✓ Why archive your A / B test results?
A structured approach to optimizing and analyzing past performance results in more growth and better test results.
✓ What is p-value in A / B testing?
The p-value is a measure of evidence against the null hypothesis (control, in the language of A / B testing). The p-value does not tell us the likelihood that B is better than A.
✓ What does a P value of 1 mean?
When the data is fully described by the restricted model, the probability of obtaining less well-described data is 1. For example, if the sample means in the two groups are identical, the p-values of the t-test are 1.
✓ How does the P value relate to Type 1 and Type 2 errors?
For example, a p-value of 0.01 would mean there is an 1% -th probability of making a type 1 error. However, using a lower value for alpha means that you are less likely to find a true difference if it does exist (which creates the risk of a type error 2).
✓ What if the P value is 0?
1 indicates rejection of the null hypothesis at the 5% significance level. 0 indicates inability to reject the null hypothesis at the 5% significance level.